
In the last months, I have been working on an app to manage the results of foosball matches. This was a side project for me to try out the ionic framework and to use the Firebase toolkit in a real application.
Both projects (ionic and firebase) have a large community and receive a lot of praise online. There is a big problem, though, that tends to be underestimated: There is a difference between tutorial content and application!
In a tutorial, all answers to questions are laid out for you, you don’t have to find them. While that format has the advantage of introducing the core problems, names, entry points, etc. of a project to you, it hides one aspect: If you have a project idea and want to use say ionic or firebase in that project, how hard will it be to get it running for your special requirements?
The answer to this question is complex because there is no easy way to determine it and no straight forward path to it either. One part of the answer could be “How many posts on StackOverflow do you find about a certain problem you have?”. Imagine you run into a problem while setting up a given toolkit on a special operating system – for argument’s sake let’s say Gentoo Linux. One of the commands you are supposed to run doesn’t work. You google the error message. The number of good responses, the time it takes until you have resolved your issue, is crucial to how well a framework suits your needs and a tutorial has nothing to do with that.
For that reason, I try to come up with little project ideas of my own and implement them on diverse software stacks to get to know them. The experience of applying them is very educational I feel.
One of these project ideas was to create an app that could store results from foosball matches we play at work. However, if you hand an applied mathematician a long list of game results (numbers) he will eventually want to do something with those numbers. So I decided to figure out how to compute the strength of the players involved. This was especially interesting to me because I play online games that also have MMR (Multiplayer Matchmaking Rating) systems and find the topic interesting.
Introduction to ELO
The logical starting point is chess. The ELO system in chess is well established and works really well in the sense, that it offers good predictive properties for matches for two players whose ELO has been computed on a sufficiently large dataset of match results. The idea is simple: Every player is assigned a rating number. The higher this number is, the stronger the player is assumed to be. For every match result between two players, an update is computed where they exchange a certain number of points so the total number of points across all players stays the same (Number of players in the system * starting rating). The “only” difficult part is then to compute said update.
The system is especially simple because there are only three possible results for a chess match: player a wins (1 : 0), player b wins (0 : 1) or a draw (0.5 : 0.5). The basic assumption of ELO is, that the expected outcome for a player should be $$ E_a = \frac{1}{1+10^{(R_b – R_a)/400}} $$
Where \(R_b\) is the rating of the opponent, \(R_a\) the rating of the player himself, and 400 a tuning parameter. We can then observe multiple properties about this system:
- The expected result of both players adds up to 1 as do all the possible outcomes above: $$ E_a + E_b = 1 $$
- If \( R_a = R_b \) we find $$E_a = \frac{1}{1+10^0} = 0.5 $$ so for two equally strong players the expected outcome is a tie which makes sense and
- If \( R_a > R_b \) we find $$ c := (R_b- R_a) /400 < 0$$ and therefore
$$ E_a = \frac{1}{1+ 10^{c}} > \frac{1}{1 + 1} = 0.5 $$ and vice versa for \( R_a < R_b \).
Graph 1 shows how many points this system expects a player to make based on the assumption his rating is 1600.
Infobox: You can recreate this graph in Gnuplot using the following commands:
> Set xrange [1200:2000]
> Set ytics 0.5
> Set grid
> Set yrange [0:1]
> Ra = 1600
> Ea(x) = 1.0 / ( 1.0 + 10.0**((x - Ra)/400.0))
> Plot Ea(x)
Extension to multiplayer
When we play foosball in the office, however, we don’t play one-against-one (1v1). Instead, we usually play 2v2. For each team, one player plays the two defensive lines and the other player plays the two offensive lines. We also switch teams, so computing a rating for the team would not suffice, so building a rating system for this setup is not as simple as for chess – especially because a player can be very good playing one position and unexperienced playing the other one, so a single rating value for a player is also not enough.
To account for the givens of the situation I decided to give every player two rating values: one for when they play offense and another for their performance on defense. A first, easy, approach would be, to regard a match as two games with the same result. “Offender A against Defender B” would be the one match and “Defender A against Offender B” the other and I would give both the same result.
To show the shortcomings of this solution imagine the following situation: 3 beginners play with a world champion. Team A has beginners in both positions. The world champion would play defense on team B. The consequence would be that team A would not score a single goal, therefore Team B would likely win independently of how strong team b’s offense player would be. A 10:0 win for offense B vs. defense A, however, would mean a big rating increase for the B’s offense player (assuming the three beginners were all still at their starting rating of 1600). The system is currently blind to the strength of the player that you are playing with when judging your performance – which makes no sense for a team game.
For this weighing impact, I chose to go with a ¾ to ¼ distribution, so the relevant match for you is mostly your matchup against your direct opponent but also your teammate’s matchup against their opponent.
Computing a rating update
For standard rating, the update equation is $$ R^{new}_a = R^{old}_a + 20 * (S_a – E_a) $$
where \(S_a\) is the actual outcome of the match and \(E_a\) the expected outcome on the basis of the rating discussed above. So if \(S_a\) is bigger than \(E_a\) you gain rating, otherwise, you lose rating. For the 2v2 foosball case we need to make two adaptations:
- The score has to be transformed to represent the performance. The obvious choice is to say 0:10 is a performance of 0 and 10:0 is a performance of 1 (we always play until one side scores their tenth goal, no overtime). 10:10 is not possible, so there are 20 possible outcomes: 10 where team A wins and 10 where team b wins. We distribute these results evenly between 0 and 1. So if you win, your performance is $$ S_a = 1 – \frac{g_b}{19} $$
where g_a is the number of goals the opposing team scored. If you lose, your performance is $$ S_a = 0 +\frac{g_a}{19}. $$
The number 19 occurs because you split the interval 0:1 into 19, not 20 intervals of even size since you are connecting the endpoints basically and 19 intervals separate 20 points. - To deal with the above problem of weighting the performances you compute the rating update as follows: $$ E_{d,a} = \frac{1}{1 + 10^{\frac{(0.75 \cdot R^o_b + 0.25 \cdot R_{d,b}) – (0.75 \cdot R_{d,a} + 0.25 \cdot R_{o,a}) – }{400}}} $$ where \(d\) and \(o\) represent defense and offense, \(a\) and \(b\] for the teams. This is one of two update values that have to be computed. The other one is $$ E_{o,a} = \frac{1}{1 + 10^{\frac{(0.75 \cdot R_{d,b} + 0.25 \cdot R_{o,b}) – (0.75 \cdot R_{o,a} + 0.25 \cdot R_{d,a}) – }{400}}}. $$
The updates are then $$ R^{new}_{d,a} = R^{old}_{d,a} + 20 \cdot ( S_a – E_{d,a}), $$ $$ R^{new}_{o,a} = R^{old}_{o,a} + 20 \cdot ( S_a – E_{o,a}), $$ $$ R^{new}_{o,b} = R^{old}_{d,a} – 20 \cdot ( S_a – E_{d,a}) \text{ and} $$ $$ R^{new}_{d,b} = R^{old}_{d,a} – 20 \cdot ( S_a – E_{o,a}). $$
Predicting game results
Once you have acquired a lot of game results, you can also start to compute predictions of game results. Given two teams and if all their players have well adjusted rating values, such a prediction is possible as follows:
We assume that the results will follow a normal distribution around the expected outcome. We can compute the expected outcome by averaging the ratings of the players on a team and then computing the expected outcome and transforming that value back to a score.
We can then expect the results to have a normal distributed outcome around that value. So we know what the center of the distribution is and we also know, that the sum of the probability of all possible results of a game has to be 100%. However, this is only one condition on two unknowns, because the normal distribution has two unknowns at this point:
- The value at its peak, i.e. the probability of the predicted result and
- The variance of the distribution, i.e. how likely is it, that results deviate from the prediction, or how strong is the influence of luck on a result.
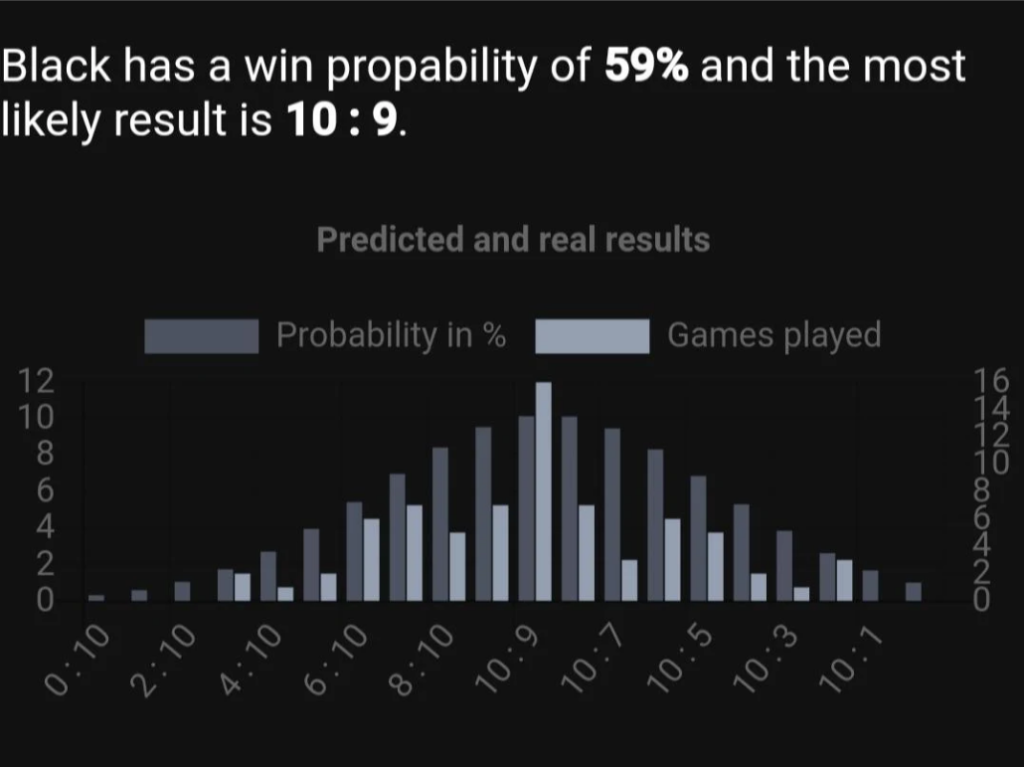
If we have many results in a database, we have a way to compute the variance of results based on past deviations against the prediction for those games. So for all games, we compute the expected outcome and the square of the deviation against that outcome and receive an estimate of the variance of results which we can use to compute the probability of results. The following picture shows prediction versus reality in an app I developed based on this algorithm.
So now we have:
- A stable rating system for games.
- An extension to team games.
- An algorithm to predict results based on player ratings.
I will soon add an article explaining how to implement this in JavaScript. Until then – stay tuned!